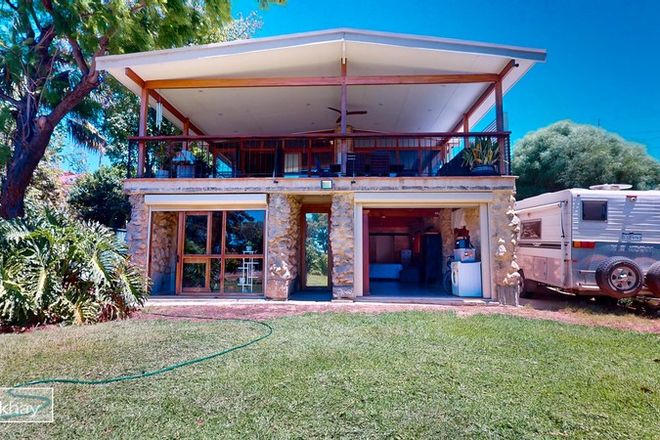
 3
3 2
2 6
6| Sold Date | Sold Price |
|---|---|
| Feb 2026 | $2,100,000 |
| Listing Date | Listing Type | Listed Price | Link |
|---|---|---|---|
| 2025-02-14 | For sale | Expressions of Interest | Link |
| 2024-09-06 | For sale | From $2,500,000 | Link |
| 2024-08-30 | For sale | Private inspection 5/9/24 message to register! | Link |
| 2018-05-18 | For sale | LOW $1 MILLIONS | Link |
| 2018-03-23 | For sale | All Offers Presented. | Link |
| 2018-03-02 | For sale | AUCTION 21ST MARCH AT 12 NOON (IF NOT SOLD PRIOR) | Link |
| 2013-09-09 | For rent | $850 per week | Link |
| 2013-08-19 | For rent | $995 Weekly | Link |
| 2013-07-19 | For rent | $850 | Link |
| 2013-07-01 | For rent | $900 p.w. | Link |
| 2012-07-22 | For sale | $1,490,000 | Link |
| 2012-06-17 | For sale | $1,595,000 | Link |
| 2012-05-27 | For sale | $1,695,000 | Link |
| 2012-04-01 | For sale | $1,750,000 - $1,950,000 | Link |
Below you will find a price per sqm scatterplot chart of sold properties for the postcode 6004. This chart reveals the relationship between sold prices verses land size. Feel free to click on/hover over the particular dot points as they will highlight the property for that sale. You are also able to compare the relationship by clicking on previous years as offered below the chart. A "best fit" curve represents the relative relationship between the sold price and landsize. We call this the Price Per SQM Co-Efficient Curve™. A regional comparison is provided by the purple curve.
 Research Reports
 Chart Data
 Property Explorer
 Postcode Snapshot
 My Property Report
 Distressed Properties

 Free Property Data